


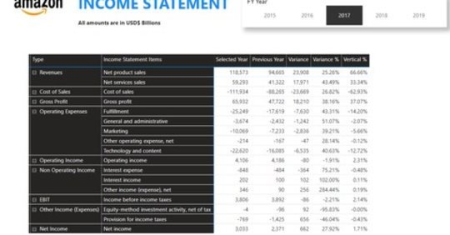
Power BI - Financial Reporting with Basic Analysis and Chart
Genre: eLearning | MP4 | Video: h264, 1280x720 | Audio: aac, 44100 Hz
Language: English | VTT | Size: 968 MB | Duration: 6 section | 28 lectures | (2h 22m)
Step by step instructions from start to end on designing an Income Statement (P&L), Balance sheet and Cash flow statement in Power BI.
What you'll learn
Power BI
Requirements
None
Description
Course Overview
100% Online
Self paced
Study anywhere
Study any
20+ Instructor Videos
's Financials Case Study
5 hours learning
Step by step instructions
Submit exercise as part of Assignment
Certificate of Completion
Ideal for Finance and Accounting professionals
Learning Outcomes
Create a dynamic full set of Financial Statements from Excel in Power BI
Perform vertical and horizontal analysis
Visualise Financial performance through Charts and Dashboards
Learn simple DAX to measures
What We Cover
How to Install and Get Started with Power BI.
Data Preparation in Excel for your Financial Statement model.
Importing your Financials data from Excel into Power Query Editor.
Cleaning and Transform your Data.
Create your Data Model for your Income Statement, Balance Sheet and Cash Flow Statement.
Use DAX formulas to create measures.
Create Visualisations for your Financial Statements.
Apply Intelligence to make reports dynamic.
Who this course is for:
Accounting
Finance
DOWNLOAD
uploadgig
rapidgator
nitroflare


Information
Users of Guests are not allowed to comment this publication.

